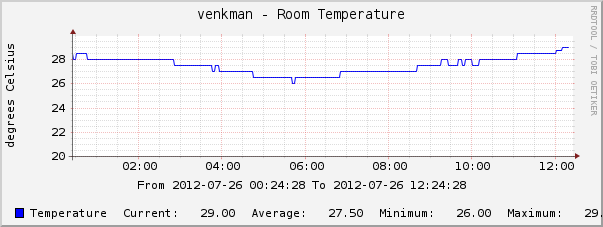
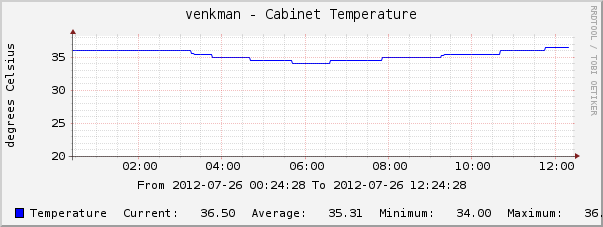
I graph the temperature of my server cabinet (at home) and colocation room (at work) in Cacti, using TEMPer USB thermometers. I wrote a handy guide to doing this last year. Unfortunately that guide, and the software I wrote, only worked to query one device. Today I modified it to graph more than one device, and started graphing the ambient temperature of my house.
As you can see, we’re having an unusually warm day in London:
This guide replaces the original one.
1a. Install temper-mon, all dependencies, and udev rules
Users of Debian wheezy/sid or Ubuntu precise should add my precise repository, and run:
sudo apt-get update
sudo apt-get install temper-mon
That’s it. You now have all the required dependencies, the temper-mon program, and a udev rule that allows unprivileged users to query TEMPer devices. You can also download the .deb package directly if you want to try it on another distribution.
Alternatively …
1b. Install temper-mon, all dependencies, and udev rules
If you don’t use a recent Debian/Ubuntu release or don’t want to install my package, however, you’ve got more work to do. Follow steps 1-3 of the original guide. However, use this updated version of temper-mon, and copy it to /usr/bin/temper-mon.
2. Verify that temper-mon can read your device
Now disconnect and reconnect the TEMPer. Verify that you have the correct device with lsusb:
# lsusb
Bus 005 Device 004: ID 1130:660c Tenx Technology, Inc. Foot Pedal/Thermometer
Make sure your device has ID 1130:660c, or temper-mon won’t work for you. This USB device must have “rw-rw-rw-” permissions. The udev rule installed by my package ensures this. Verify with:
# ls -la /dev/bus/usb/005/004
crw-rw-rw- 1 root root 189, 515 Jul 25 21:46 /dev/bus/usb/005/004
Now check that the web server user can run temper-mon:
sudo -u www-data temper-mon
If you get a reading, you’re ready to move on to the next step. If you have more than one device, test each of them as well:
sudo -u www-data temper-mon 2
or:
sudo -u www-data temper-mon -a
3. Import Cacti templates
Import my “Local – Ambient Temperature” template into Cacti. A copy is also installed by my package in /usr/share/temper-mon.
If you want to modify this template, such as for graphing in degrees in Fahrenheit, see this how-to for graphing data from a script in Cacti.
4. Create Cacti graphs
We are finally ready to create a graph.
- “Management” -> “Devices” -> Select your Cacti server
- Click “Create Graphs for this Host”
- “Graph Templates” -> “Create:” -> select “Local – Ambient Temperature” from pull-down
- Under “Custom Data”, Set “Number of device (default is 1)” to the number of the device. If you have one device, leave this blank or set it to 1. For other devices use 2 and up, as you found in step 2 above.
- Press “Create”
That’s it! You now have a temperature graph. I recommend using the threshold plugin to issue a warning alert if your server area gets too hot.
-
This guide looks to be EXACTLY what I need, however I cannot seem to locate the ‘temper-mon’ package for the Raspberry Pi, and the cpan method didn’t work.
Do you have plans to update the Temper-mon Package to allow it to function on the Raspberry Pi? The ability to run more than one sensor from a single PC is awesome!
Karel


20 comments
Comments feed for this article
Trackback link: https://www.tolaris.com/2012/07/25/graphing-data-from-temper-usb-probes-in-cacti-part-2/trackback/